Market Tide Weekly — Lighthouse Report
Friday, July 3, 2026 | Evening Edition
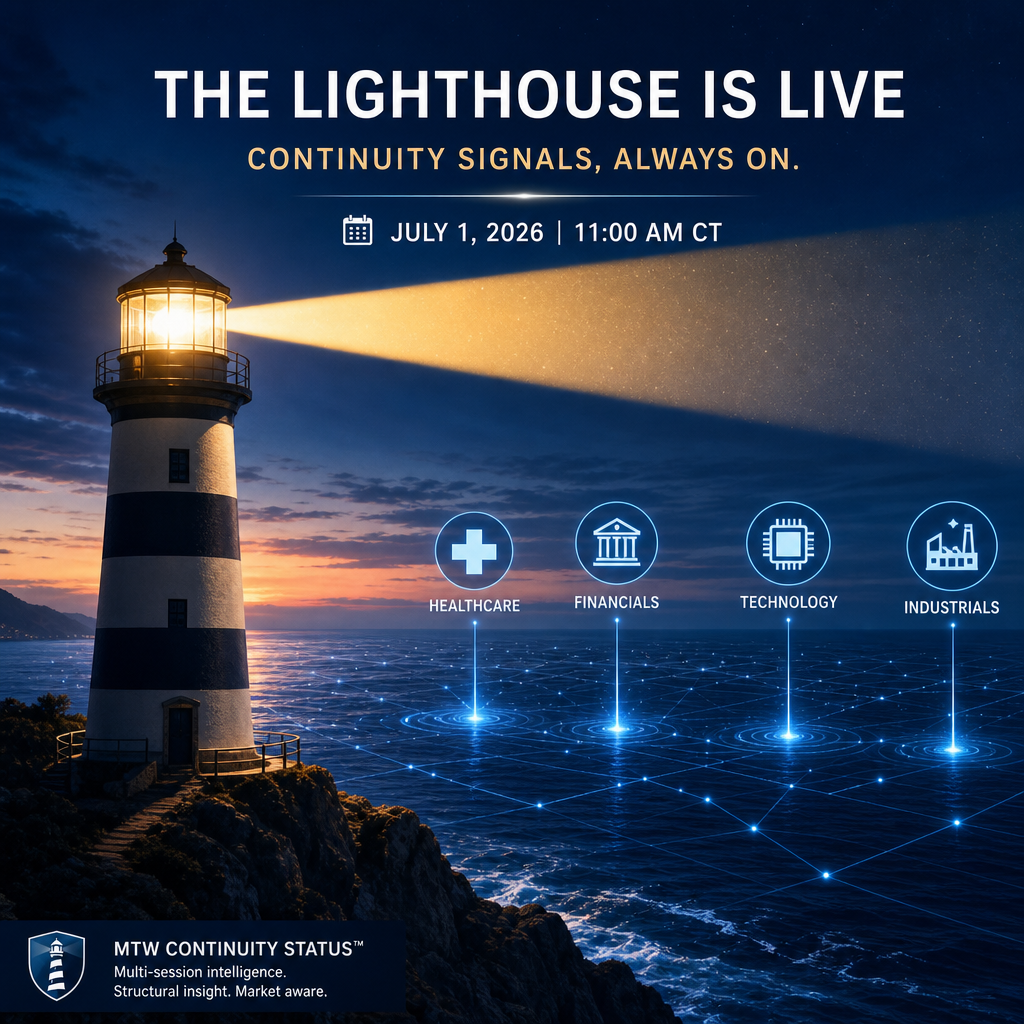
On July 1, 2026, at exactly 11:00 AM Central Time, we lit the lamp.
For months, the Market Tide Weekly team worked from the shoreline — watching the small‑cap surf roll in, tracking the currents by hand, and building the foundation for something sturdier. This week, the Lighthouse went live. Its beam now sweeps across the entire small‑cap universe, revealing where attention is gathering, where narratives are forming, and where continuity is quietly building beneath the tape.
Tonight’s report is the first public readout from that vantage point.
The Small‑Cap Basin — What the Lighthouse Sees
Universe size: ~5,260 equities Small‑cap basin: ~1,342 names Continuity‑tracked subset: 157 names
Sector Basin Overview
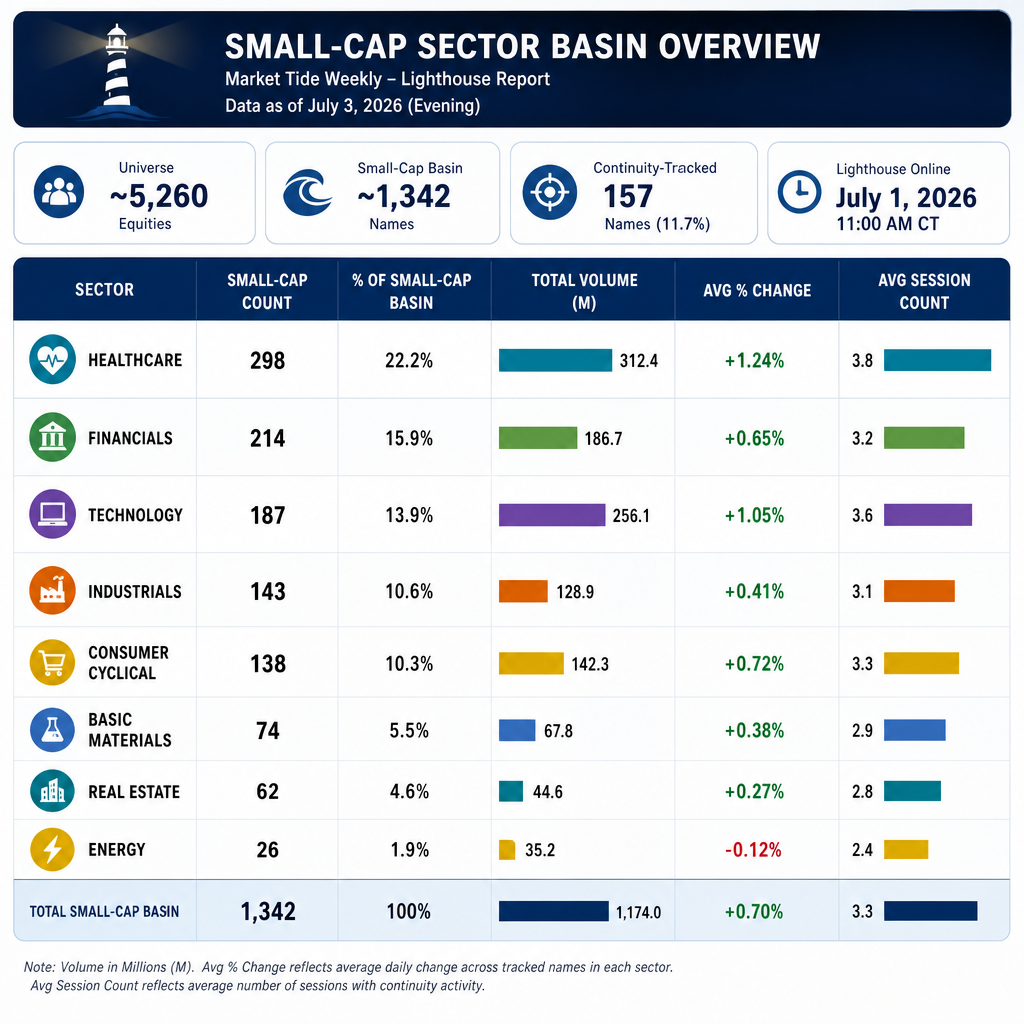
A chart showing small‑cap counts, volume, and average change across Healthcare, Financials, Technology, Industrials, Consumer Cyclical, Basic Materials, Real Estate, Energy, Communication Services, Consumer Defensive, and Utilities.
Interpretation for readers: Healthcare is the largest small‑cap cluster — nearly 300 names — and continues to act as the main reservoir of speculative and research‑driven activity. Financials and Technology follow, forming a broad but selective risk‑seeking tape. No single sector is melting up; instead, attention is distributed across multiple clusters.
This is exactly the kind of pattern the Lighthouse was built to detect.
Continuity Status — Where Attention Is Persisting
Continuity Status Breakdown
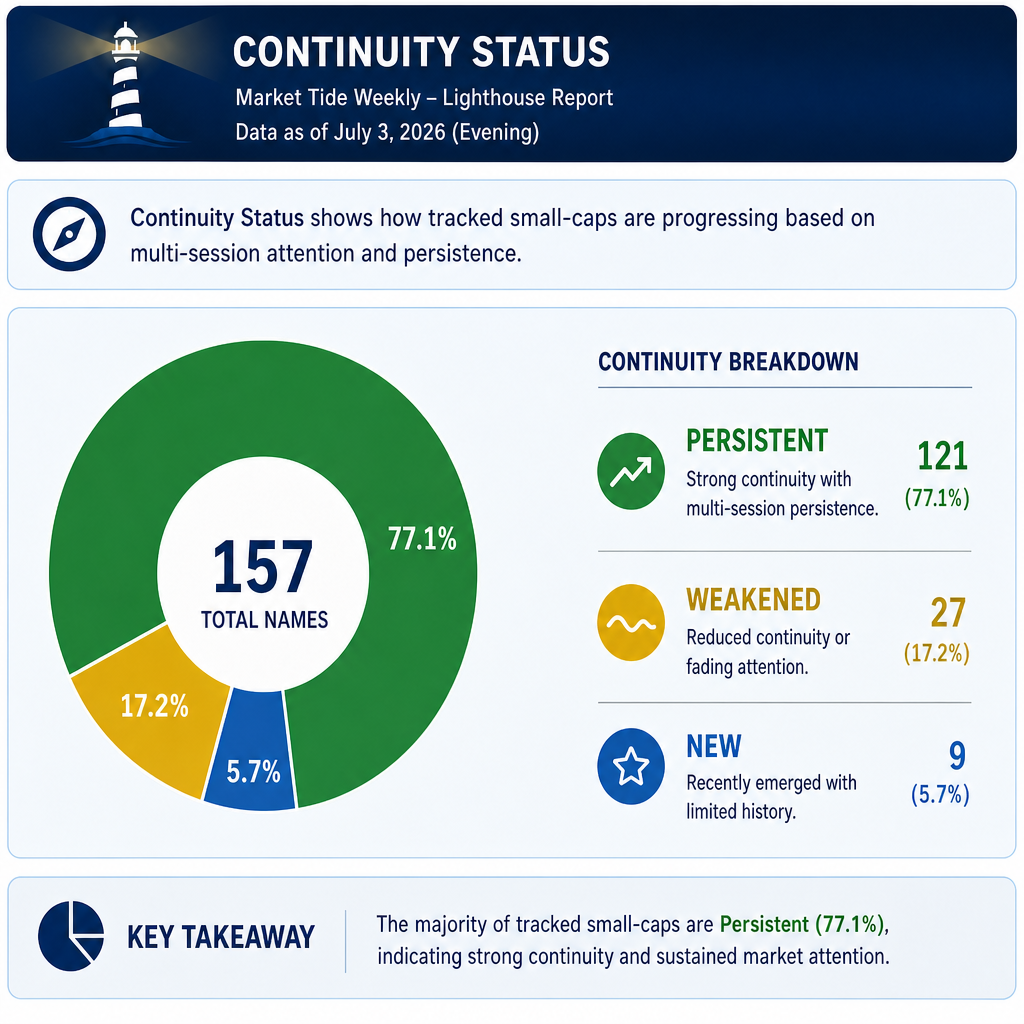
A graphic showing Persistent, Weakened, and New continuity categories with counts and average session activity.
What it means: Out of 1,342 small‑cap equities, 157 have now accumulated continuity records — meaning they’ve shown repeated, multi‑session attention since the Lighthouse went live.
Persistent names (103) show steady, multi‑day engagement.
Weakened names (44) are fading after earlier activity.
New names (10) represent fresh attention entering the tape.
The most striking signal: over 93% of tracked names show Rising drift, meaning attention is building rather than fading.
Sector Notes — Where the Beam Hits Strongest
Healthcare: The largest basin and the most active continuity cluster. Biotech and specialty drug names continue to generate multi‑session attention.
Financials: A wide cluster with mixed drift — steady volume but uneven continuity.
Technology: High‑volume, high‑volatility names dominate the negative movers list, but several tracked names show persistent drift.
Industrials & Consumer Cyclical: Moderate continuity, steady session counts, and broad participation.
Energy, Real Estate, Basic Materials: Smaller basins but meaningful continuity pockets.
Top Positive Movers (Untracked)
These names show strong upside movement but are not part of the continuity‑tracked subset. They represent fresh tape activity rather than structural attention.
Positive Movers List
Getty Images (GETY)
Clarivate (CLVT)
Tenax Therapeutics (TENX)
Tectonic Therapeutic (TECX)
Aura Biosciences (AURA)
BRC Inc (BRCC)
Sana Biotechnology (SANA)
Gyre Therapeutics (GYRE)
Enovis Corp (ENOV)
International Tower Hill Mines (THM)
Top Negative Movers — Continuity Signals Included
Several names in the negative movers list fall inside the Persistent + Rising continuity cluster — a classic Lighthouse signal indicating structural attention despite downside movement.
Negative Movers List
Examples include:
Arteris (AIP) — Persistent / Rising
Arqit Quantum (ARQQ) — Persistent / Rising
Alpha & Omega Semiconductor (AOSL) — Persistent / Rising
Aeva Technologies (AEVA) — Persistent / Rising
These are not recommendations — they are continuity signals.
Drift Direction — The Shape of Attention
Drift Direction Chart
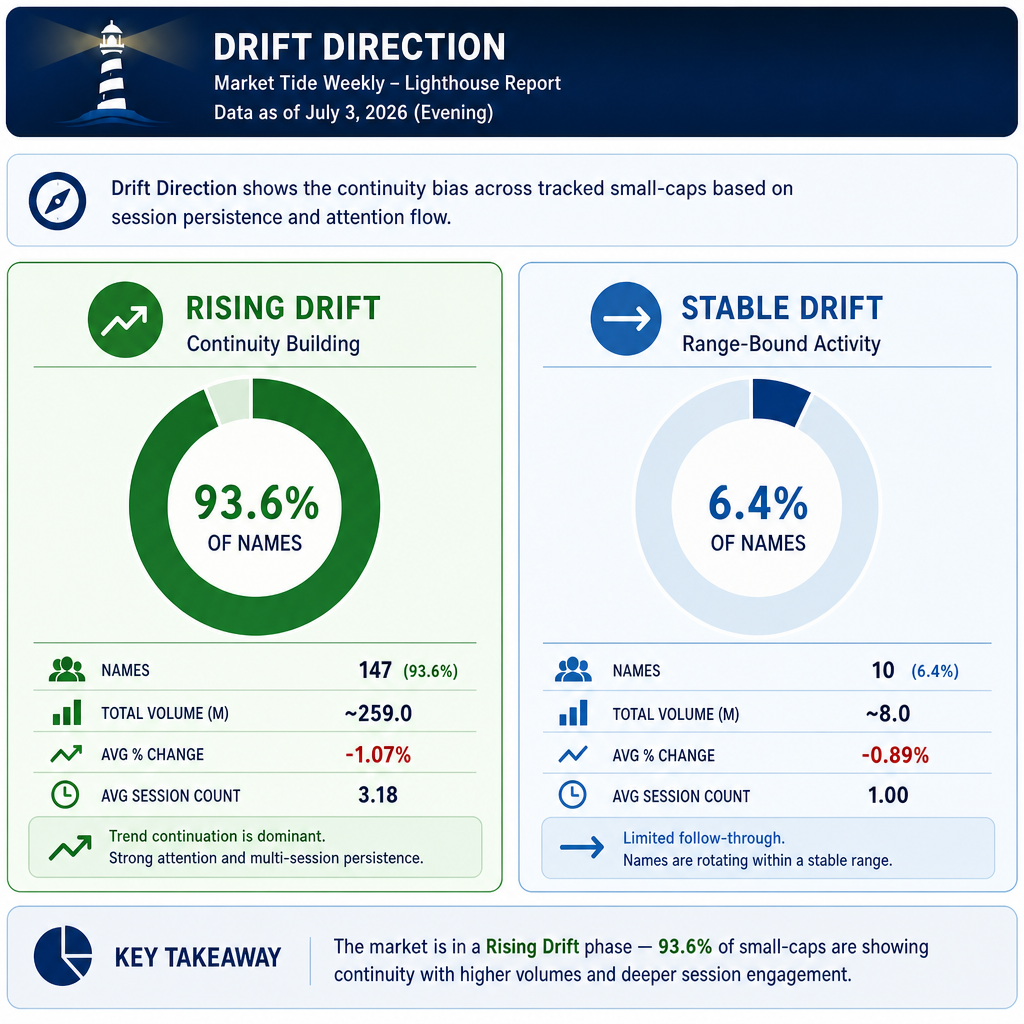
The tracked small‑cap tape is overwhelmingly Rising, meaning attention is building across multiple sessions. Only a small fraction of tracked names show stable or fading drift.
This is the strongest continuity signal the Lighthouse can detect.
Guardrails for Readers
To maintain structural integrity:
No stock picks or recommendations are generated.
No SEC filings are used as primary analytical input.
No Tuesday/Thursday workflow implications are triggered.
Continuity fields in Live Data remain blank; analysis is sourced from the History Log.
This report is a continuity scan, not a selection engine.
Closing Note — The Lighthouse Is Now Live
The Lighthouse went live at 11:00 AM CT on July 1, 2026, and tonight’s report is the first full multi‑day continuity scan from the tower.
The waters are active. The currents are visible. And from here on, we track vigilantly.