Lighthouse Continuity Analysis: Stable Market Breadth and Financial-Led Expansion
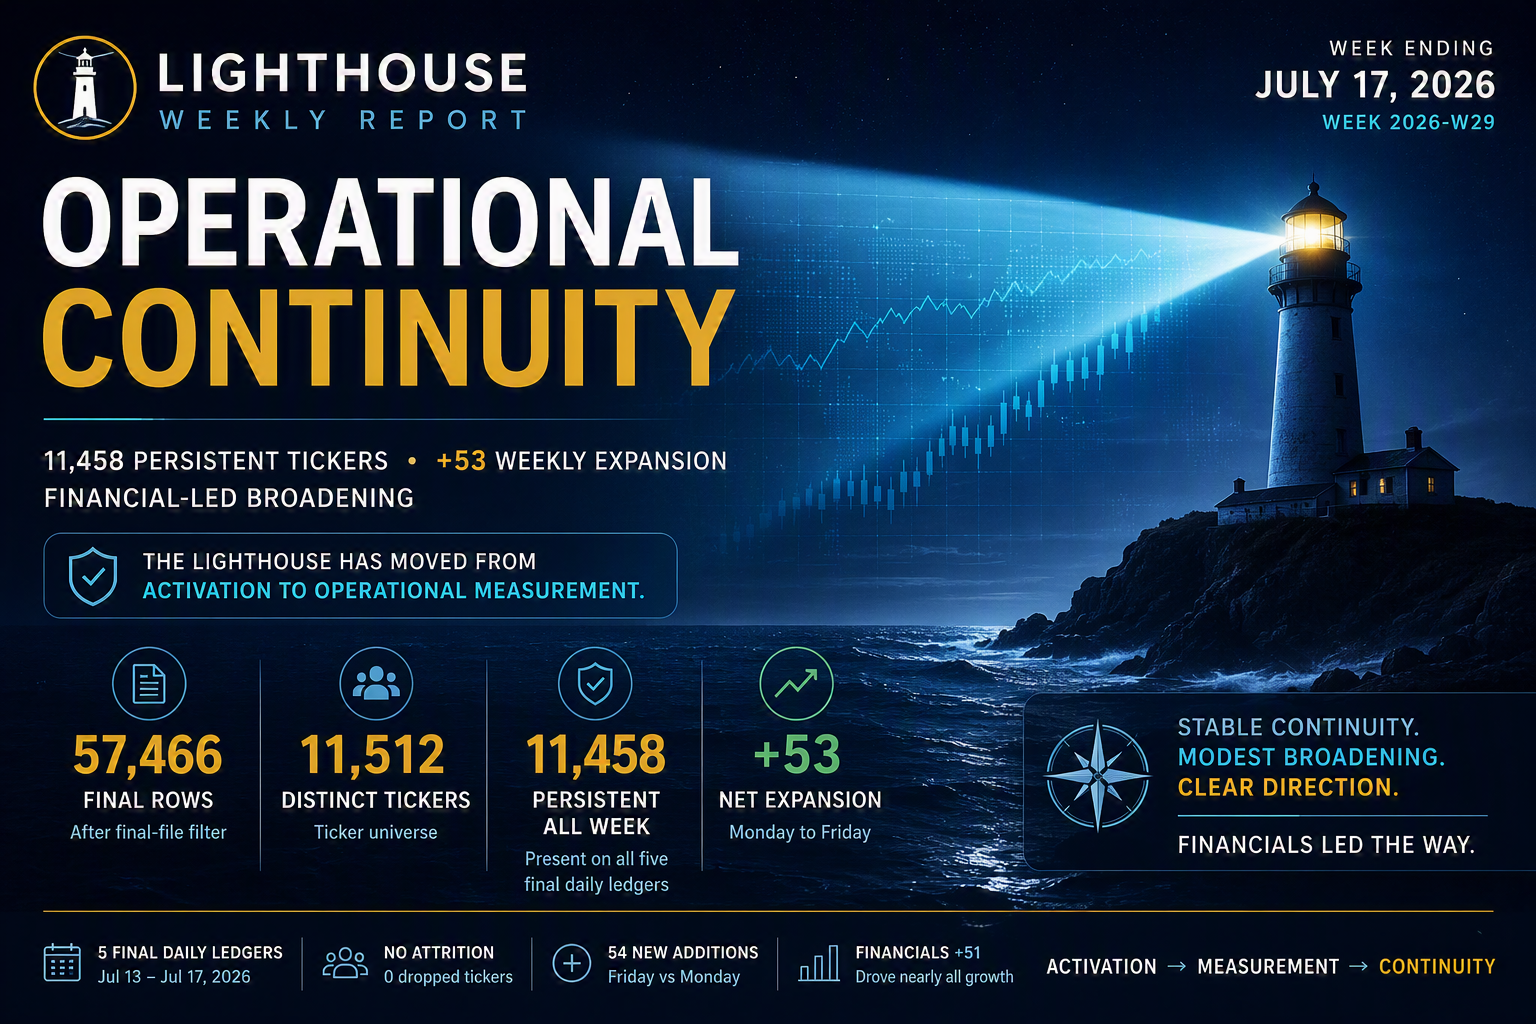
Lighthouse Weekly Report — Continuity Analysis - Week ending July 17, 2026
1. Executive Summary
· Last week’s report marked the Lighthouse system coming fully online; this week’s report shows that system moving from activation to operational measurement.
· The week’s primary signal was continuity rather than disruption: the final-file corpus expanded modestly while maintaining near-complete ticker persistence.
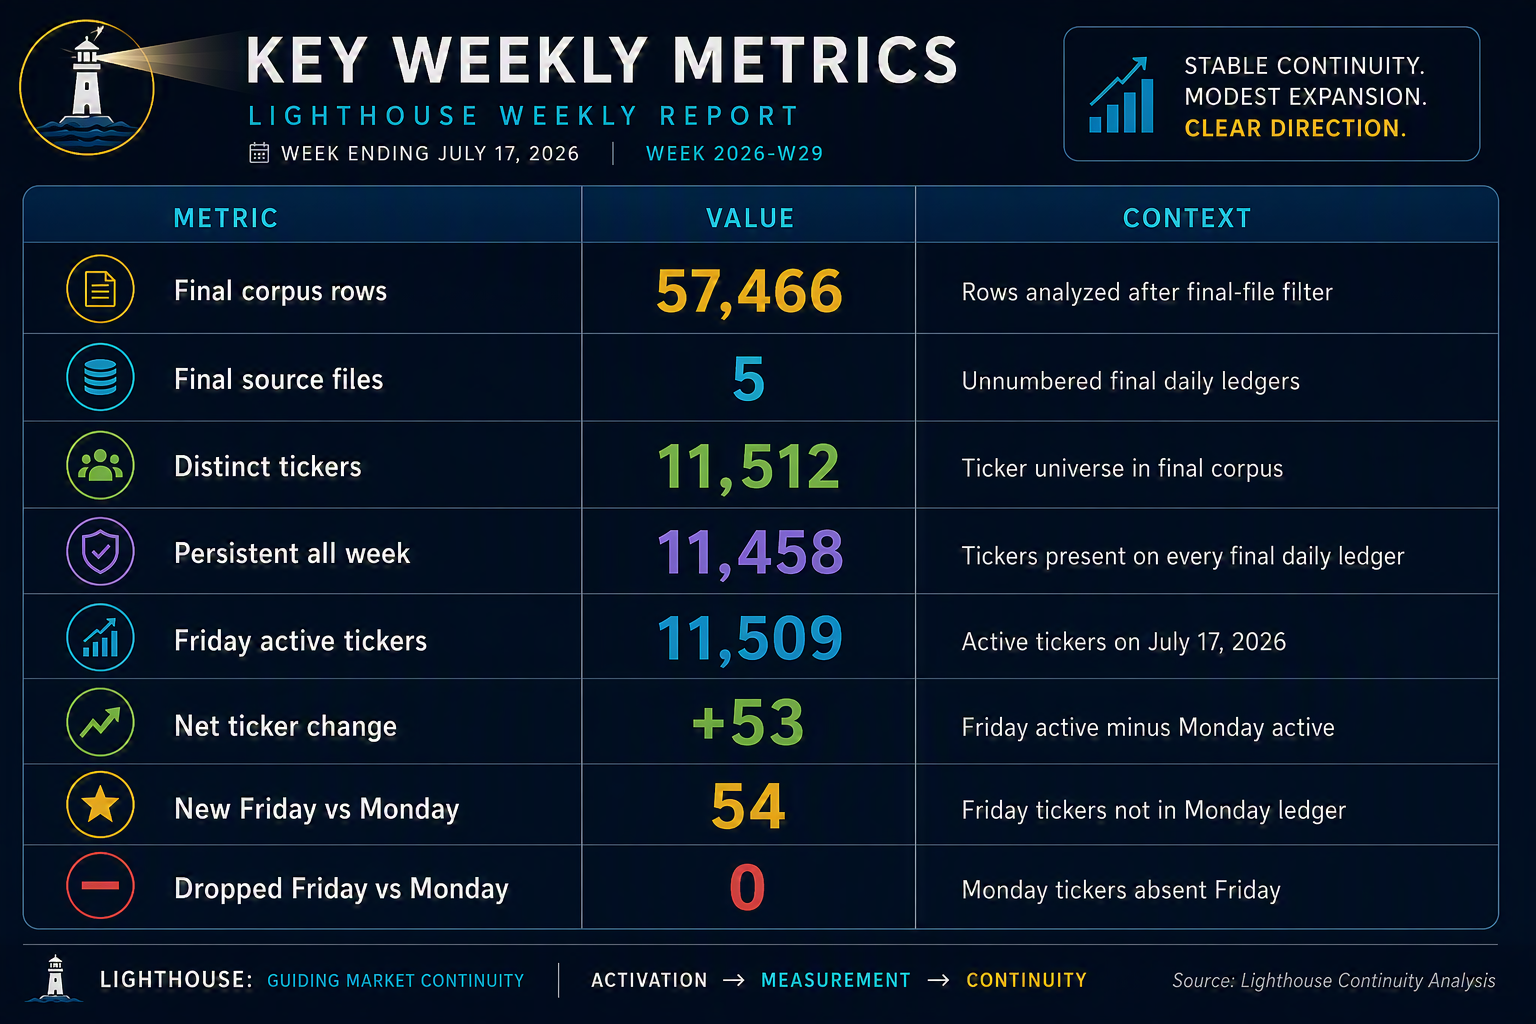
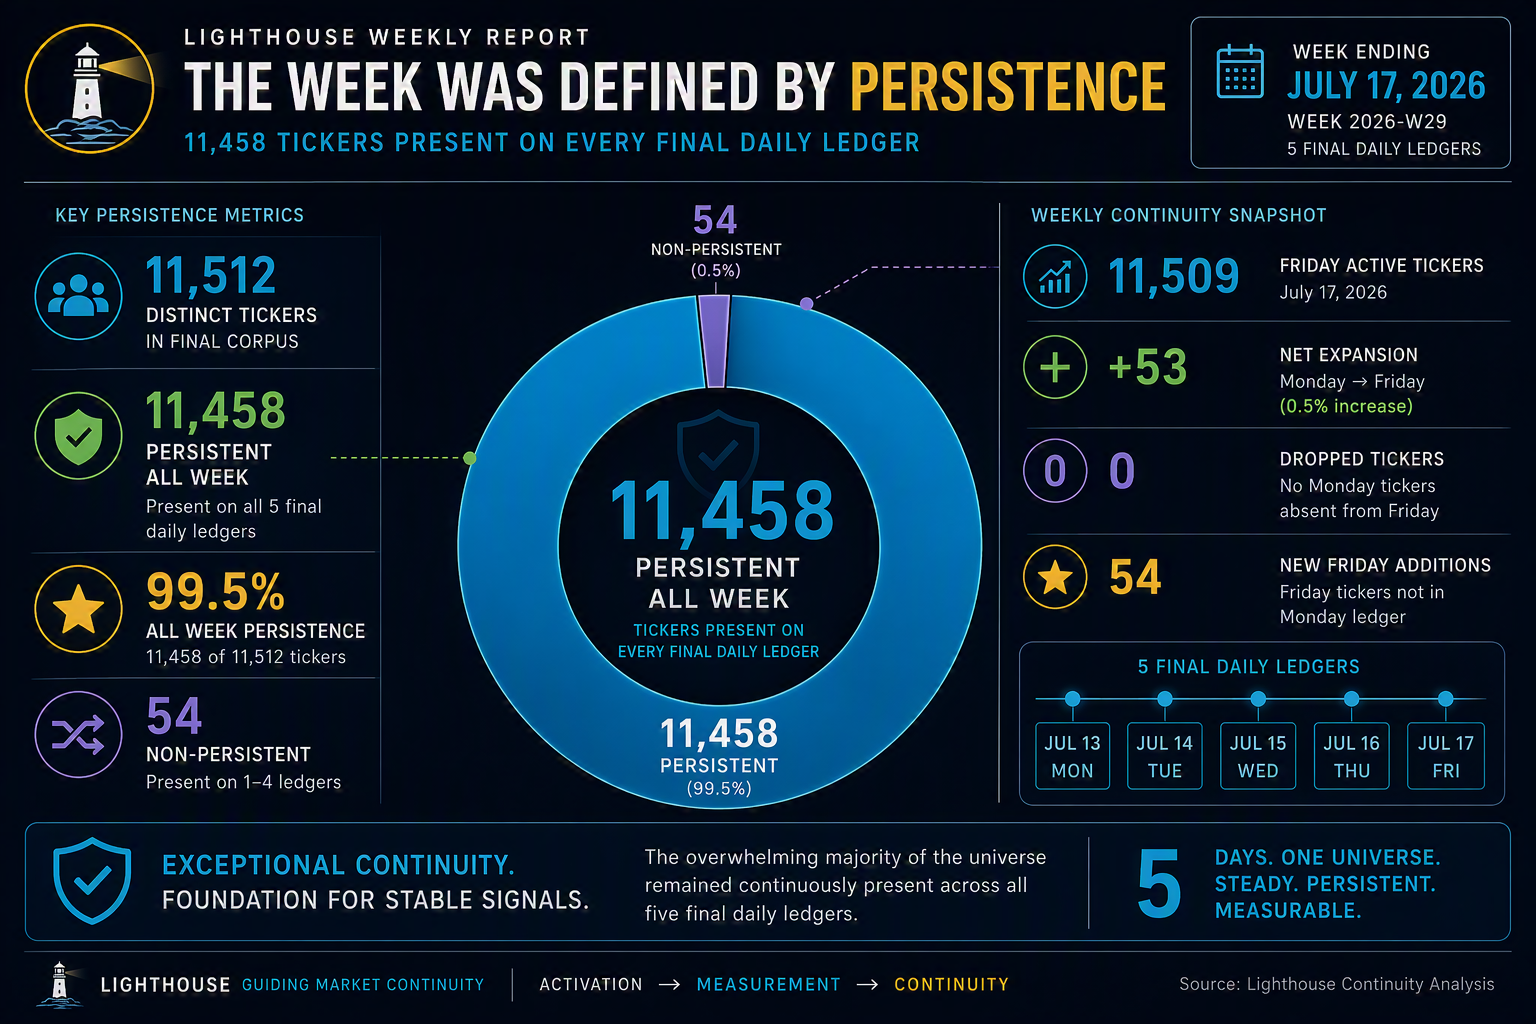
· Final corpus coverage totaled 57,466 rows across five unnumbered final daily ledgers, representing 11,512 distinct tickers and 11,458 tickers present all week.
· Within the week, Friday active tickers reached 11,509, up 53 from Monday, a 0.5% increase, with no Monday tickers absent from the Friday ledger.
· The practical implication is that the Lighthouse is now producing a stable weekly readout: modest broadening, controlled continuity, and sector expansion concentrated primarily in Financials rather than broad cross-sector rotation.
Summary of key findings: The Lighthouse system has moved from activation to operational measurement, producing a stable weekly continuity readout from five final daily ledgers. The final corpus covered 57,466 rows, 11,512 distinct tickers, and 11,458 all-week persistent tickers. Active tickers rose by 53 from Monday to Friday, with no Monday tickers absent from the Friday ledger, while continuity score firmed late in the week from 1.01 to 1.03. Sector expansion was concentrated primarily in Financials, indicating modest broadening within an otherwise steady sector map rather than broad cross-sector rotation.
Key weekly metrics:
Story in brief: The week 2026-W29 Lighthouse continuity analysis shows a stable final-file universe with modest expansion. Active tickers rose by 53 from Monday to Friday, with no Monday tickers absent from Friday and 11,458 tickers present on every final daily ledger.
2. Key Charts
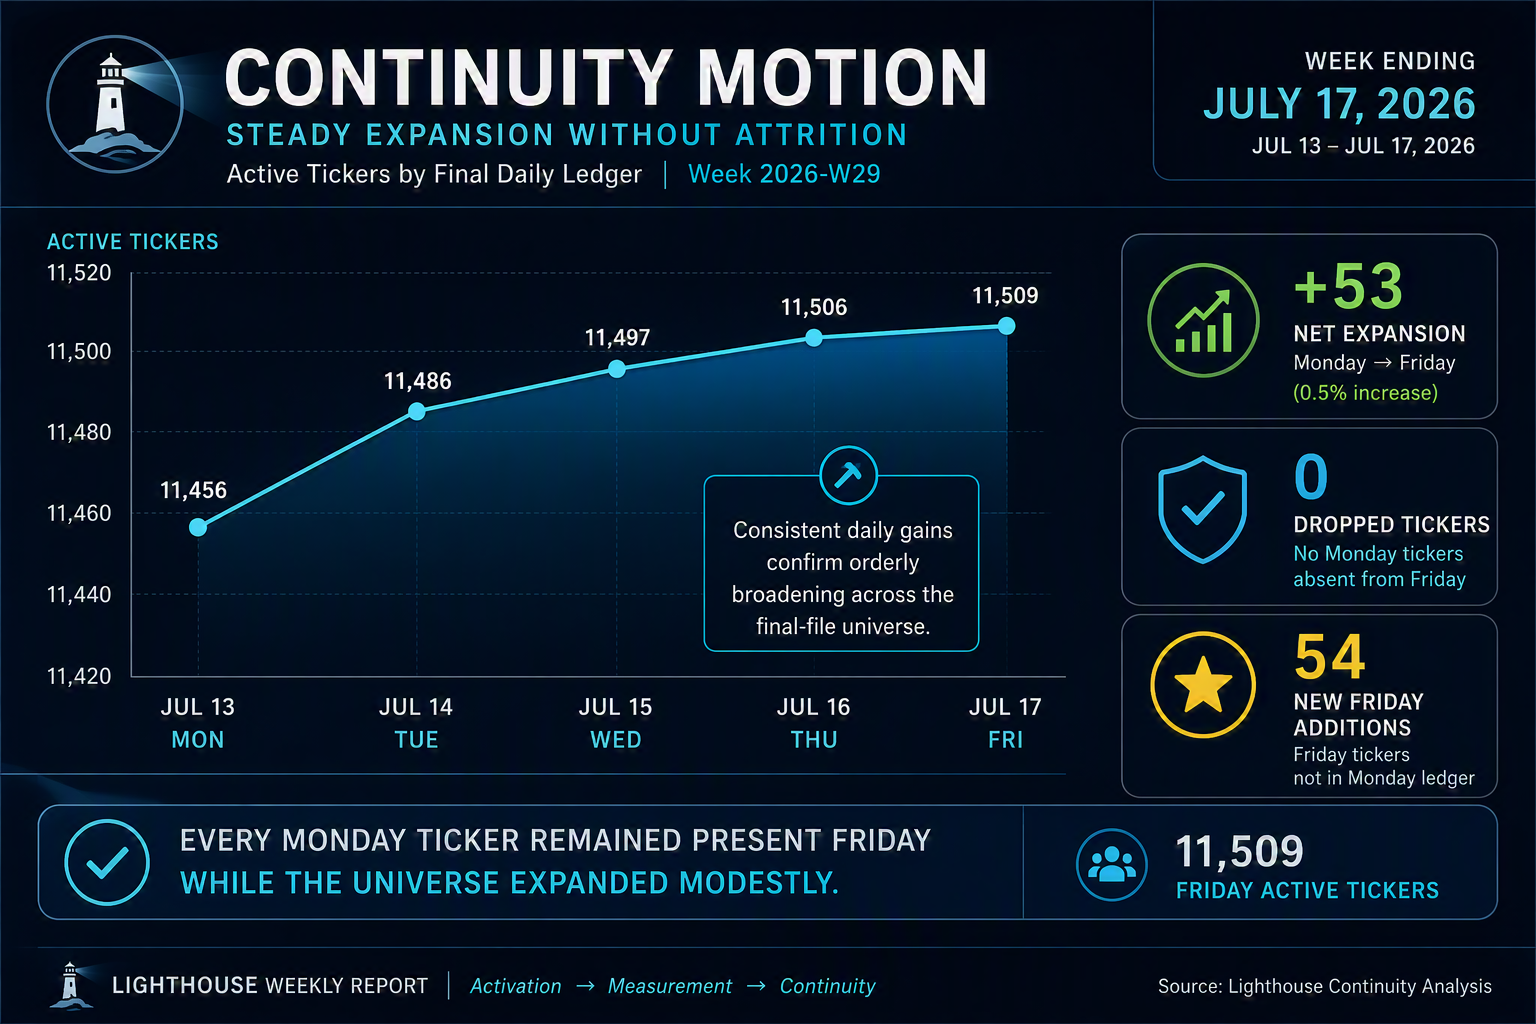
Chart 1: Continuity Motion Line
The continuity motion line shows a slow, orderly climb rather than a volatile surge. Active tickers increased each day from 11,456 on Monday to 11,509 on Friday, confirming modest broadening across the final-file universe. The key takeaway is stability with incremental expansion: the Lighthouse did not detect meaningful attrition during the week, and the active universe ended the period slightly larger than it began.
Source data: Jul 13 = 11,456; Jul 14 = 11,486; Jul 15 = 11,497; Jul 16 = 11,506; Jul 17 = 11,509.
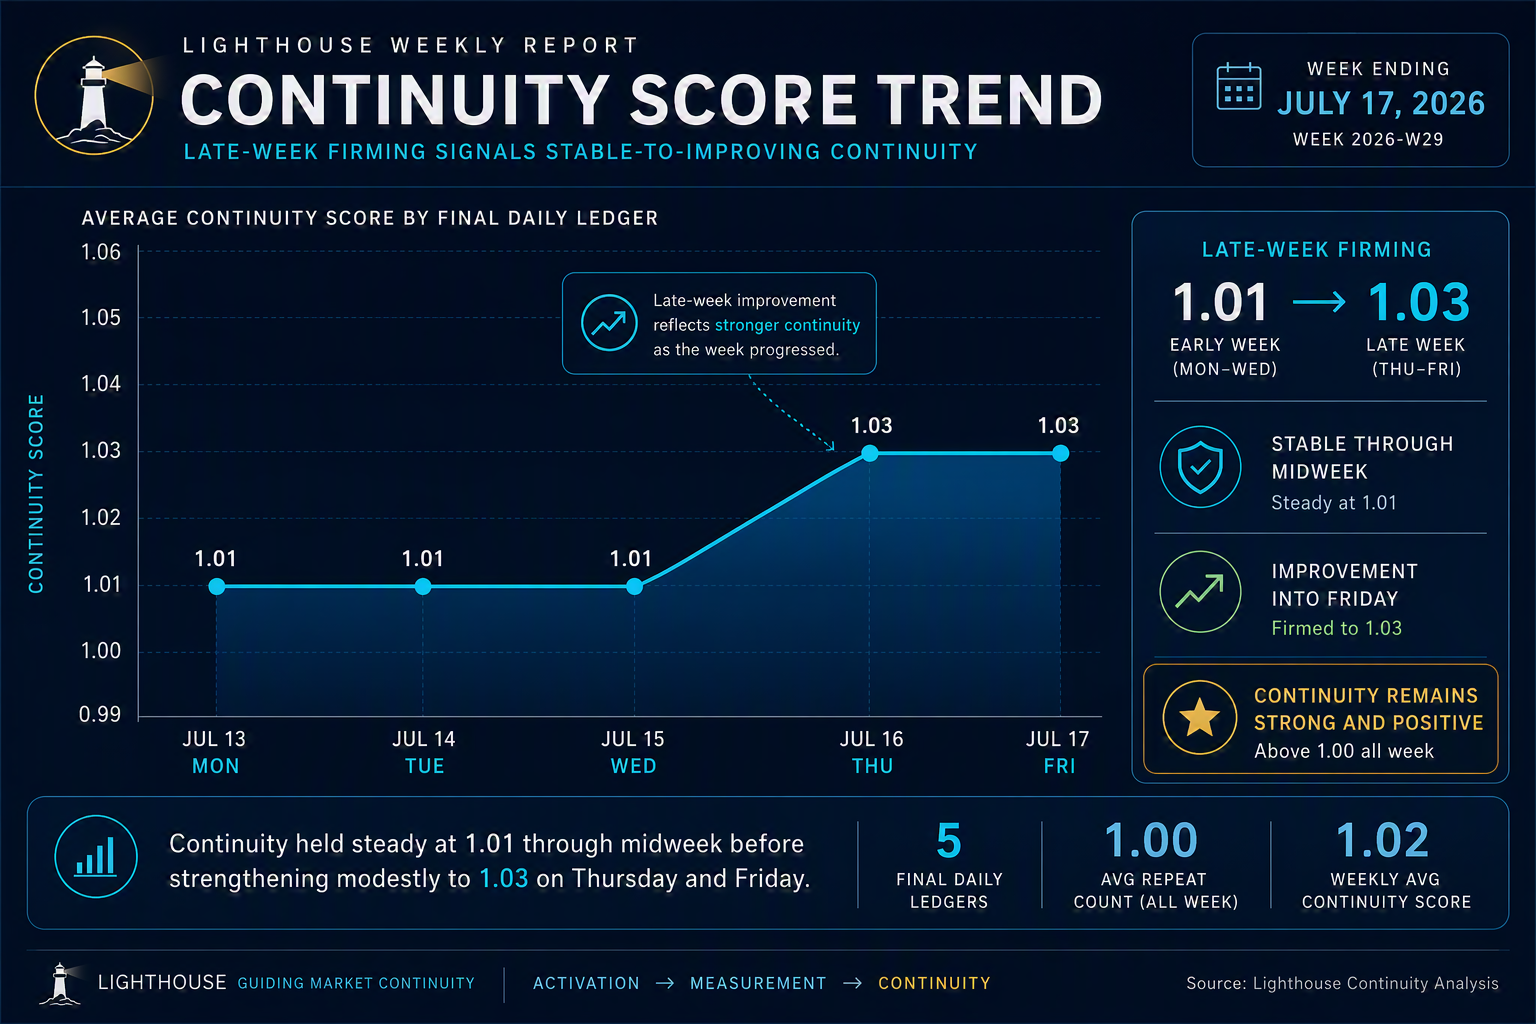
Chart 2: Continuity Score Trend
The continuity score trend emphasizes late-week firming. Average continuity score held at 1.01 from Monday through Wednesday, then moved to 1.03 on Thursday and Friday. That shift is small, but it supports the broader message that the system produced a stable-to-improving continuity readout rather than a weakening signal.
Source data: Jul 13 = 1.01; Jul 14 = 1.01; Jul 15 = 1.01; Jul 16 = 1.03; Jul 17 = 1.03.
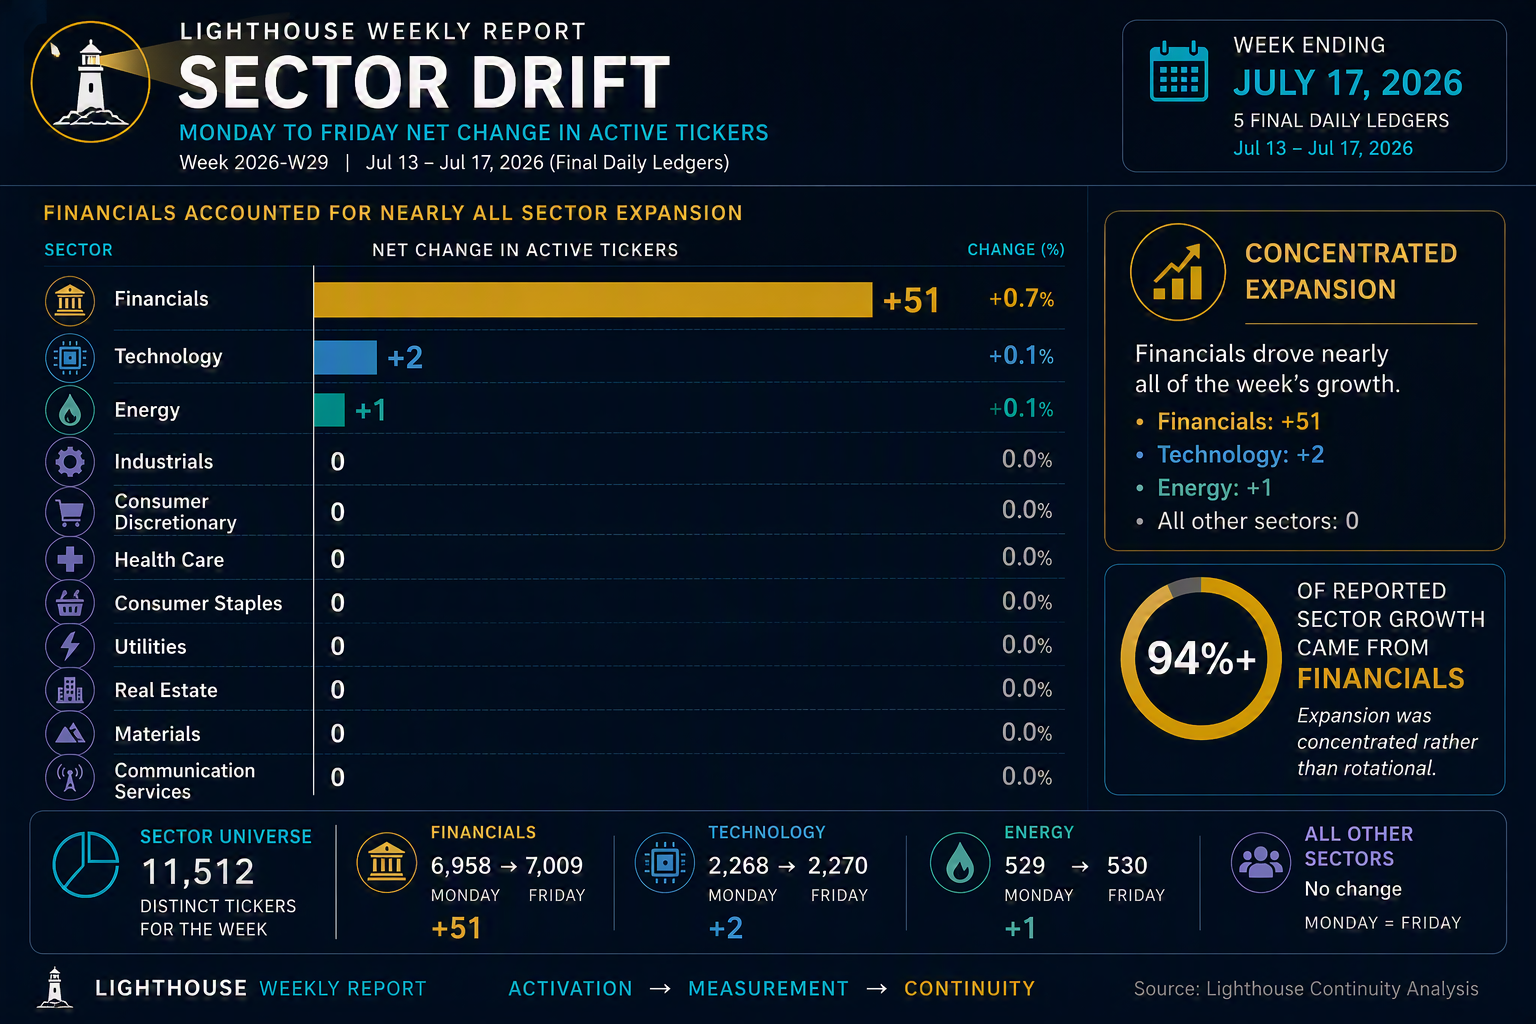
Chart 3: Sector Drift Bar
The sector drift bar makes the concentration of expansion immediately visible. Financials drove nearly the entire Monday-to-Friday increase, adding 51 tickers, while Technology added 2 and Energy added 1. All other listed sectors were flat. The chart therefore supports a disciplined interpretation: this was not broad sector rotation, but a Financial-led expansion within an otherwise steady sector map.
Source data: Financial +51; Technology +2; Energy +1; all other listed sectors 0.
3. Continuity from Last Week
Last week’s report marked the Lighthouse system coming fully online: the continuity engine, ledger structure, drift arcs, anomaly flags, and sector heatmap were framed as the operating machinery needed to track the market’s tide in real time. This week’s report turns that activation into measurement. The Lighthouse is no longer only described as ready; it is producing a stable weekly signal from five final daily ledgers.
The change from last week is structural, not numerical. Last week established the system’s purpose: to turn raw market fragments into continuity, drift, anomaly, and sector-motion intelligence for working-class investors. This week shows that purpose in operation, with 57,466 final-file rows, 11,512 distinct tickers, 11,458 all-week persistent tickers, and a modest +53 active-ticker expansion from Monday to Friday.
This distinction guides the reader’s interpretation. Week over week, the Lighthouse moved from system activation to operational reporting. Within this week, the operational readout shows stable continuity, no Friday attrition versus Monday, and sector expansion concentrated primarily in Financials.
4. Market Tide Snapshot
· The current continuity reading is stable-to-improving: average continuity score moved from 1.01 early in the week to 1.03 on Thursday and Friday.
· The active ticker universe increased from 11,456 on July 13 to 11,509 on July 17.
· The strongest continuity feature was persistence: 11,458 tickers were present on every final daily ledger.
· No Monday tickers were absent from the Friday ledger, while 54 Friday tickers were new versus Monday.
5. Intraweek Continuity Movement
· Intraweek continuity movement centers on the +53 net active-ticker change and the 54 new Friday tickers versus Monday.
· The change appears meaningful as a continuity confirmation rather than a sharp regime shift, given the small 0.5% increase and the absence of dropped Friday tickers.
· The daily row count increased steadily from 11,458 on July 13 to 11,512 on July 17.
· Validation note: the publication-facing summary uses only the five unnumbered final files, excluding duplicate source versions from the broader workbook query.
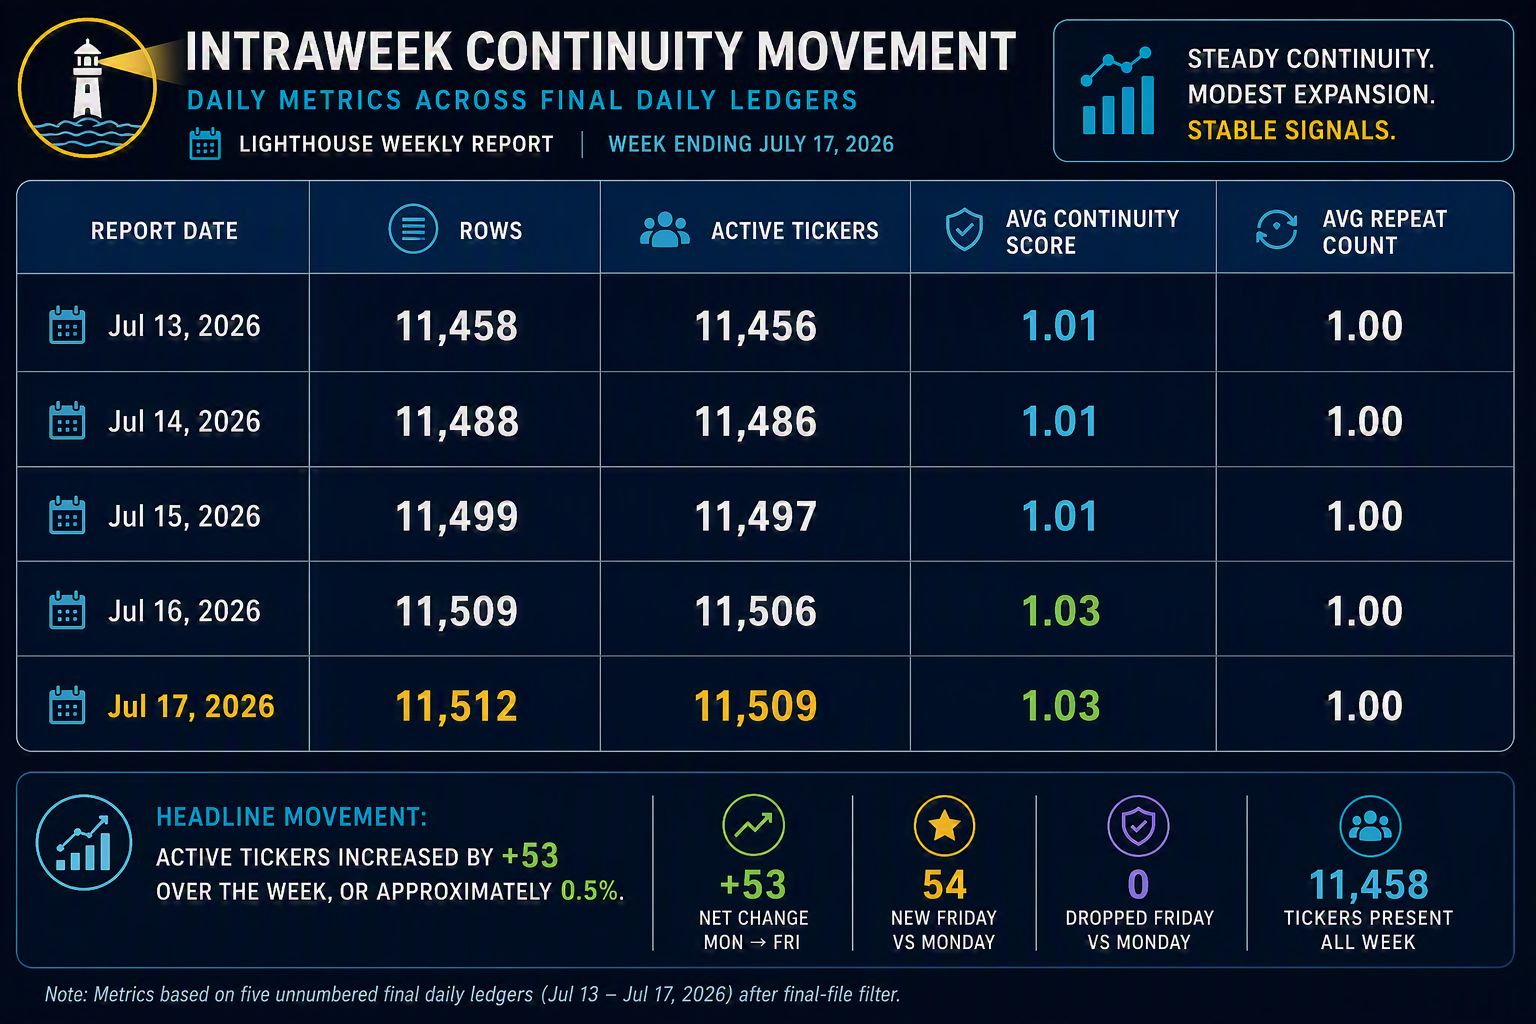
Headline movement: active tickers increased by 53 over the week, or approximately 0.5%.
6. Breadth, Momentum, and Participation
· Participation broadened slightly across the week, with active tickers rising by 53 from Monday to Friday.
· Momentum in the continuity data was gradual and orderly rather than abrupt: average repeat count remained 1.00 each day, while average continuity score edged up to 1.03 late in the week.
· The main leadership-cycle support is the large all-week persistence base of 11,458 tickers.
· The participation signal supports a stable Lighthouse reading with modest positive drift, not a decisive acceleration signal.
7. Risk Environment
· The primary risk qualifier is data construction rather than market deterioration: duplicate file versions were excluded to avoid overcounting.
· The broader workbook query loaded 838,412 rows from 73 source-file versions, but the publication-facing weekly continuity summary is limited to 57,466 final-file rows.
· Because Monday-to-Friday dropped tickers were zero, the continuity dataset does not show evidence of broad participation loss during the week.
· Risk interpretation remains measured because the publication universe is based on final-file filtering and excludes duplicate source versions.
8. Sector and Asset-Class Observations
· Financials accounted for nearly all sector expansion, rising from 6,958 tickers Monday to 7,009 Friday, a net gain of 51 or 0.7%.
· Technology added 2 tickers, while Energy added 1 ticker; all other listed sectors were unchanged from Monday to Friday.
· The sector drift profile points to concentrated expansion rather than broad cross-sector rotation.
· Technology carried the highest average score among listed sectors at 1.12, while most other sectors remained at 1.00.
9. Watchlist for Next Week
· Watch whether the average continuity score holds above 1.03 or slips back toward 1.01.
· Monitor whether Financial-sector expansion continues or begins to rotate into other sectors.
· Track whether new Friday additions persist into the next week’s final ledgers.
· Review whether the five-file final-ledger basis remains consistent in next week’s publication universe.
10. Source and Methodology Note
This report is based on the Lighthouse continuity analysis for week 2026-W29. The publication-facing summary uses only the five unnumbered final daily ledgers to avoid duplicate-version overcounting. The broader workbook query loaded 838,412 rows from 73 source-file versions; after applying the final-file filter, the weekly continuity summary reflects 57,466 final-file rows.
The continuity measures in this report are designed to evaluate persistence, active-universe movement, and sector drift across the final daily ledgers. Monday-to-Friday comparisons are based on the July 13 through July 17, 2026 final files, while week-over-week interpretation reflects the transition from last week’s Lighthouse system activation narrative to this week’s operational continuity readout.