Market Tide Weekly Lighthouse Report — Quick Scan
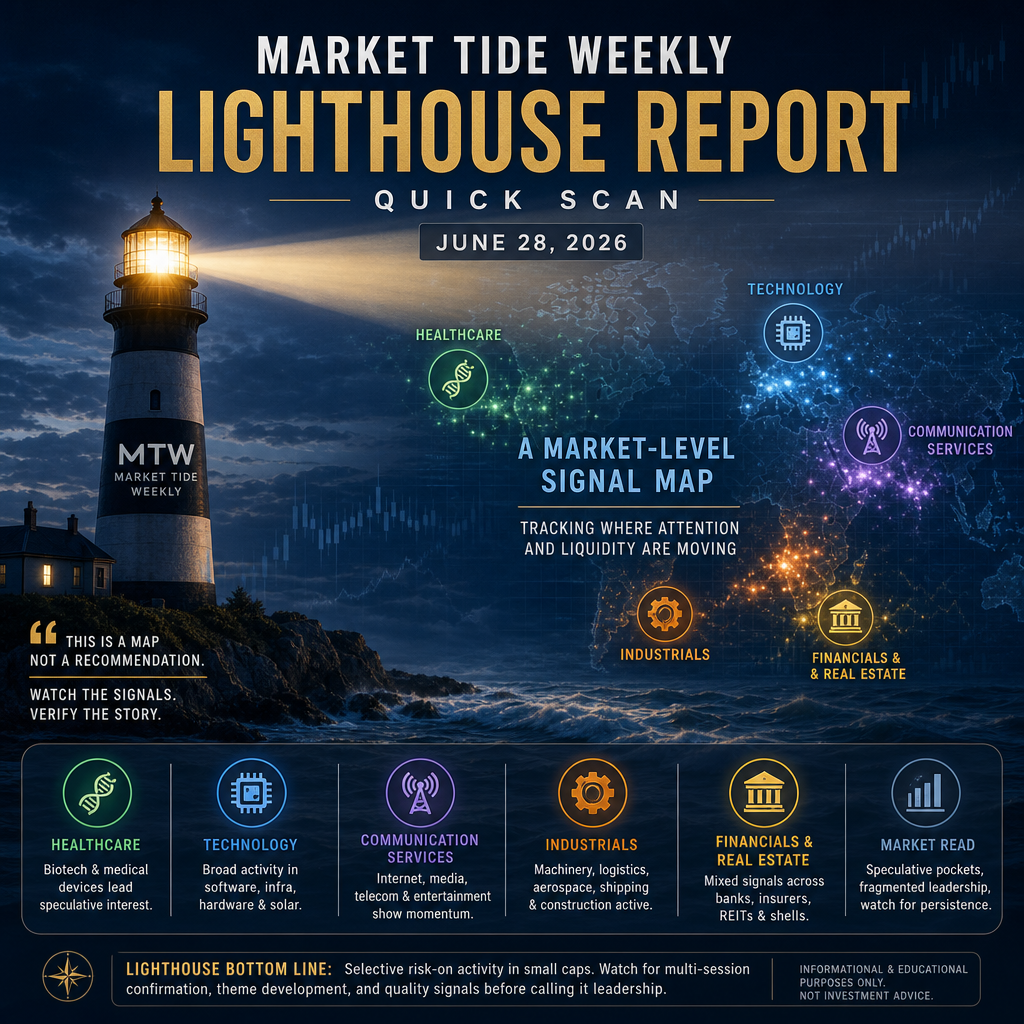
The lighthouse stands above the speculative tide — scanning the horizon for patterns, not predictions. Market signals, not noise.
Date: June 28, 2026
Source: MTW Screener, powered by Finviz Elite
Format: Lighthouse Report — market-level signal map
Executive Signal
The screener points to a speculative, small-cap tape with concentrated activity in Healthcare, Technology, Communication Services, Industrials, and Financials. The dominant signal is not broad market leadership; it is clustered activity around volatility pockets, catalyst-sensitive sectors, low-price momentum, and high-volume single-name surges. In plain terms, this is a market map: it shows where attention and liquidity are moving, but it does not establish investable conviction on its own.
Reader summary: This week’s scan is best read as a map of where speculative attention is forming, not as a reason to chase the fastest movers. The clearest pattern is that smaller companies across healthcare, technology, communication services, and industrials are drawing bursts of volume without yet forming a clean leadership theme. For readers, the key question is whether these clusters repeat over the next several sessions; persistence would suggest an emerging market narrative, while quick reversals would point to short-term liquidity chasing.
What the Screener Is Saying
The strongest market-level pattern is the concentration in small-cap and micro-cap names. Many companies in the screen sit below $500 million in market capitalization, with a meaningful subset below $200 million. That suggests price action is being shaped less by broad institutional accumulation and more by episodic liquidity, retail attention, headline sensitivity, and sector-specific speculation.
The second signal is sector clustering. Healthcare is heavily represented, especially biotechnology and medical devices. Technology appears across software, infrastructure, solar, communication equipment, and hardware. Communication Services shows activity in internet content, broadcasting, telecom, advertising, and entertainment. Industrials appear through machinery, logistics, aerospace, construction, marine shipping, waste management, and fabrication. The mix suggests a risk-on scan, but one that remains fragmented rather than index-led.
Volume and Momentum Clusters
The most visible momentum pockets are uneven. Several of the largest percentage moves are concentrated in lower-priced names, including telecom, consumer cyclicals, internet content, media, aerospace, electric vehicle exposure, and speculative technology. High-volume activity also appears in healthcare, small-cap technology, mining, media, and infrastructure-style names. The pattern suggests traders are chasing liquidity events more than rotating cleanly into one durable sector theme.
The standout behavioral pattern is acceleration in lower-float or lower-market-cap equities. Large one-day moves are appearing alongside elevated volume, but the screen does not show enough evidence to separate durable sponsorship from short-term speculative pressure. Readers should treat this as an early-warning map of where market attention is gathering, not as confirmation that leadership has already formed.
Sector Map
· Healthcare: The largest visible cluster. Biotechnology and medical device names dominate, indicating a speculative healthcare tape with catalyst sensitivity and uneven quality dispersion.
· Technology: Software, infrastructure, solar, hardware, communication equipment, and electronic components are active. The signal is broad but not unified, suggesting opportunistic buying rather than a single technology leadership theme.
· Communication Services: Internet content, broadcasting, telecom, advertising, and entertainment names show multiple high-momentum pockets, pointing to renewed interest in smaller digital media and distribution models.
· Industrials: Activity is distributed across machinery, logistics, aerospace, construction, waste management, and shipping. This cluster may reflect cyclical positioning, infrastructure sensitivity, or company-specific event trading.
· Financials and Real Estate: Banks, insurers, capital markets names, mortgage REITs, and shell companies are present, but the signal is mixed and should be treated as liquidity mapping rather than directional confirmation.
Structural Signal Map
| Signal Zone | What Appears in the Screener | Market Interpretation | Watch Next |
|---|---|---|---|
| Healthcare breadth | Heavy concentration in biotechnology, medical devices, health information services, and specialty pharma. | Speculative capital is clustering around catalyst-sensitive healthcare names rather than broad defensive healthcare exposure. | Whether activity persists across multiple sessions or fades into isolated event-driven churn. |
| Small-cap technology | Software application, software infrastructure, solar, hardware, communication equipment, and electronic components show repeated activity. | Technology interest is broad but fragmented, pointing to opportunistic rotation rather than unified sector leadership. | Whether volume converts into sustained relative strength in software and infrastructure names. |
| Communication Services momentum | Internet content, broadcasting, telecom, advertising, entertainment, and digital media names appear across the screen. | Attention is returning to smaller communications and media assets, with several moves likely tied to volatility and liquidity rather than durable fundamentals. | Whether high-momentum media and telecom names hold gains after the initial volume spike. |
| Industrials dispersion | Machinery, logistics, aerospace, construction, shipping, waste management, and fabrication names are active. | The industrial signal is scattered and may reflect company-specific trading more than a clean cyclical rotation. | Whether activity consolidates into a clearer infrastructure, transport, or manufacturing theme. |
| Low-price acceleration | Many of the sharper movers trade below $10 and sit in smaller market-cap bands. | The tape is rewarding immediacy, volatility, and liquidity events; reversal risk rises when price action runs ahead of quality signals. | Whether low-price movers build base support or retrace once volume normalizes. |
| Financials and real estate mixed signal | Banks, insurers, capital markets names, mortgage REITs, specialty REITs, and shell companies appear, but without a single directional pattern. | This is more liquidity mapping than conviction evidence; the group does not yet show a clean macro read. | Whether regional banks, insurers, and mortgage REITs begin moving together or remain isolated. |
Market Structure Read
This screen looks like a speculative pocket rather than a clean leadership breakout. The strongest movers are scattered across unrelated industries, many with small market capitalizations and limited profitability visibility. The market appears to be rewarding immediacy: unusual volume, headline optionality, low nominal share prices, and short-term technical momentum. Without a dominant sector narrative, the scan is useful for tracking where attention is clustering, but not enough to confirm durable leadership.
The constructive read is that risk appetite remains active beneath the surface. The cautious read is that the tape is rewarding volatility more than quality. Both can be true: speculative liquidity can surface early signals, but it can also create false positives when volume spikes are not supported by improving fundamentals, stronger balance sheets, or credible operating inflections.
Signals Worth Watching Next
· Healthcare breadth: The key reader question is whether biotech and medical device activity persists beyond single-day moves or fades into isolated catalyst churn.
· Small-cap technology follow-through: Software and infrastructure names are active, but the signal becomes more meaningful only if volume turns into multi-session relative strength.
· Communication Services speculation: Internet content, broadcasting, telecom, and media names are showing momentum pockets that may signal renewed appetite for distressed or under-followed digital assets.
· Industrials dispersion: Machinery, logistics, aerospace, construction, and shipping names matter most if their moves begin to look connected rather than company-specific.
· Low-price acceleration risk: Many sharp movers trade below $10, which makes follow-through important. Without cleaner quality signals, reversal risk remains elevated.
· Speculative churn test: If sharp movers lose follow-through quickly, readers should treat the action as liquidity chasing rather than durable market leadership.
· Theme confirmation: If the same signal zones keep appearing across multiple sessions, the market may be starting to define a new narrative worth watching more closely.
Lighthouse Bottom Line
The screener points to a market that is selectively risk-on beneath the surface, but leadership remains fragmented and speculative. Healthcare, Technology, Communication Services, and Industrials are the key signal zones, with momentum concentrated in smaller, high-volume names rather than established large-cap leaders. The reader takeaway is simple: do not treat these moves as recommendations. Watch whether today’s volume anomalies become multi-session sector clusters, repeatable relative strength, or documented operating inflections.
Publication note: This Lighthouse Report is a market-level signal map for informational and educational purposes only. It is not investment advice, a recommendation, or a stock-pick list. Any company-specific analysis should be reviewed separately as part of broader investor due diligence.