ZCMD’s Reverse-Current Problem
MARKET TIDE DEEP DIVE - ZCMD
July 9, 2026
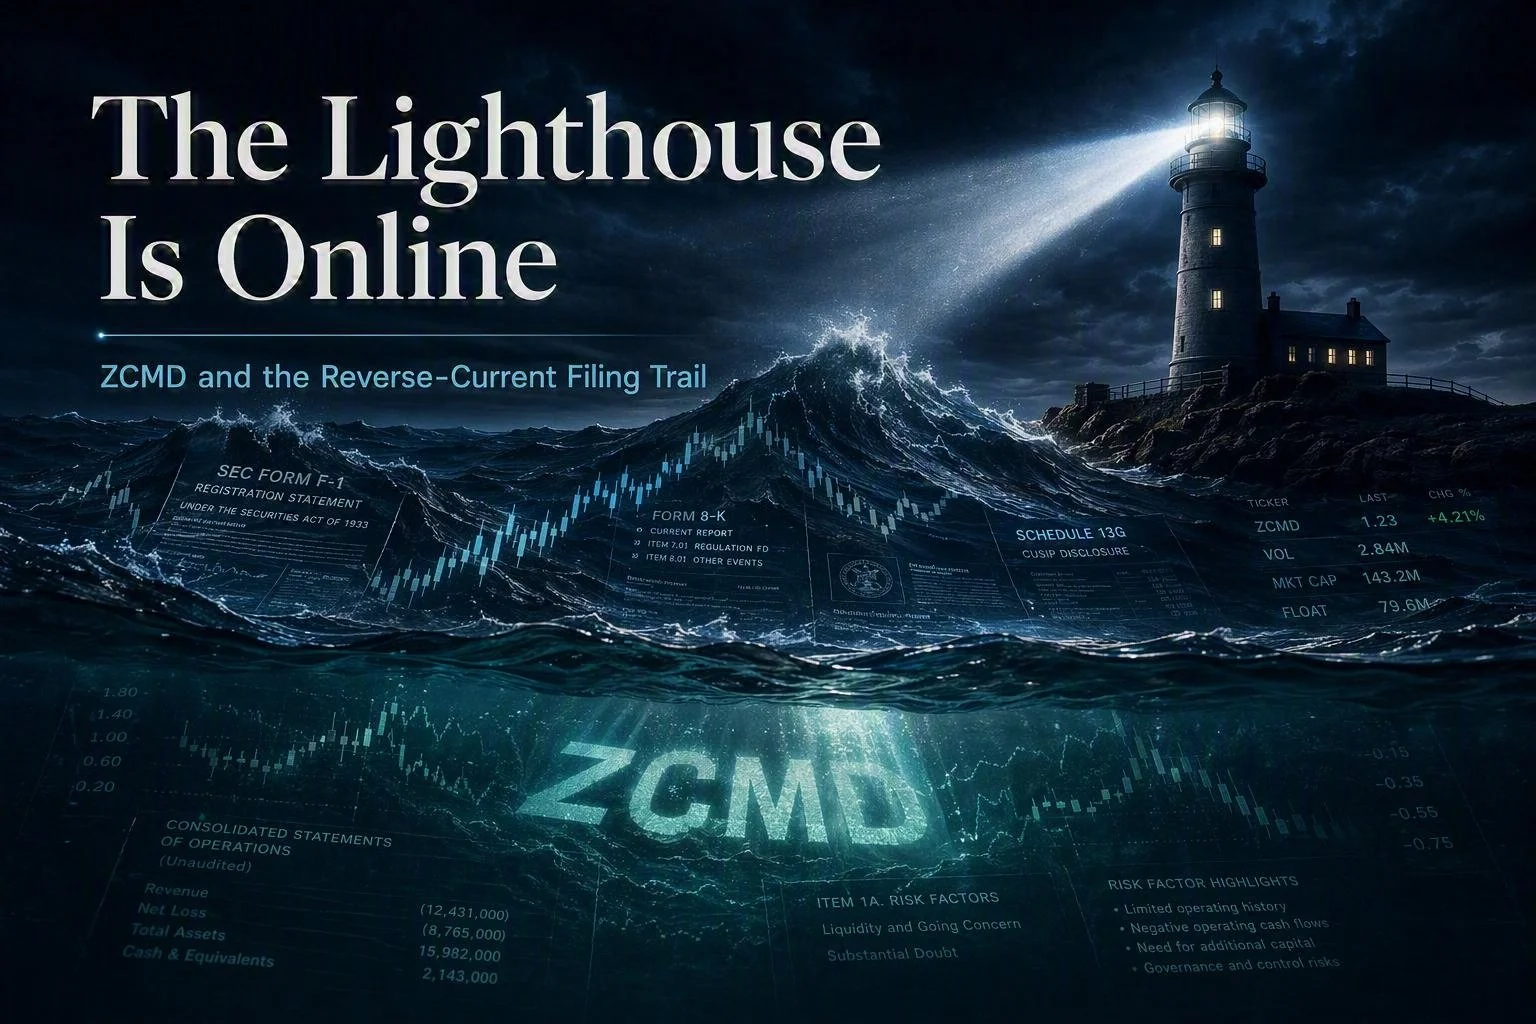
The Lighthouse beam doesn’t chase price—it scans structure. In ZCMD, a rapid sequence of filings, capital-raising activity, and reverse-share consolidations created a pattern worth investigating beneath the surface of the chart.
Why one small-cap filing trail shows the difference between price movement and structural pressure.
The Lighthouse Is Online
We built the Lighthouse because market moves rarely happen in isolation. A ticker enters a screen, exits, returns, compresses, spikes, fades, or repeats — and each movement leaves a structural trace. The old way was to read those moments as snapshots. The better way is to track the tide.
That is what the Lighthouse now does. It maps continuity, flags anomalies, tracks pressure, and shows when a company’s filings begin telling a story that the price chart alone may miss. This week, that story led us to ZCMD.
The Lighthouse was built for readers who want more than momentum headlines. It watches the continuity layer: when a company keeps returning to the same pressure points, when filings begin to cluster around capital access instead of operating progress, and when a stock’s apparent reset may be masking a deeper structural current.
This is the public version of the signal. The deeper subscriber report follows the full filing trail in greater detail — the reverse-split authority, the offering sequence, the warrant structure, the ownership disclosure, and the post-split governance cleanup that made ZCMD stand out inside the Lighthouse.
Why ZCMD Stood Out
ZCMD did not stand out because the filings showed a clean turnaround. It stood out because the filings showed a pattern. Before the 2026 capital-structure cycle began, Zhongchao’s operating disclosures already pointed to pressure: declining revenue, net losses, liquidity strain, and limited evidence of a near-term operating catalyst (Zhongchao, 6-K, Sept. 2025; Zhongchao, 20-F, 2025).
Then the structural filings accelerated. ZCMD announced and implemented a 1-for-8 reverse share consolidation tied to Nasdaq minimum-bid compliance. It then moved through a confidential draft registration statement, a public Form F-1, an amended F-1, SEC effectiveness, and a final prospectus for a public offering. Shortly after that offering sequence, the company executed a second and much larger 1-for-31 reverse share consolidation (Zhongchao, 6-K, Jan. 2026; Zhongchao, DRS, Mar. 2026; Zhongchao, F-1, May 2026; Zhongchao, F-1/A, May 2026; Zhongchao, EFFECT, May 2026; Zhongchao, 424B4, June 2026; Zhongchao, 6-K, June 2026).
The Pattern That Matters
The issue is not that any one filing is automatically disqualifying. Reverse splits, registration statements, warrants, and amended governance documents can all be legitimate tools. The issue is sequence. When weak operating disclosures are followed by broad reverse-split authority, public offering mechanics, warrant-linked financing, ownership churn, and another reverse split, the filing trail begins to say something larger.
For public readers, the takeaway is simple: ZCMD is a reminder that structural pressure can hide behind headline price movement. A post-split chart can look cleaner while the underlying filing trail tells a more complicated story. That is why we read the filings in sequence.
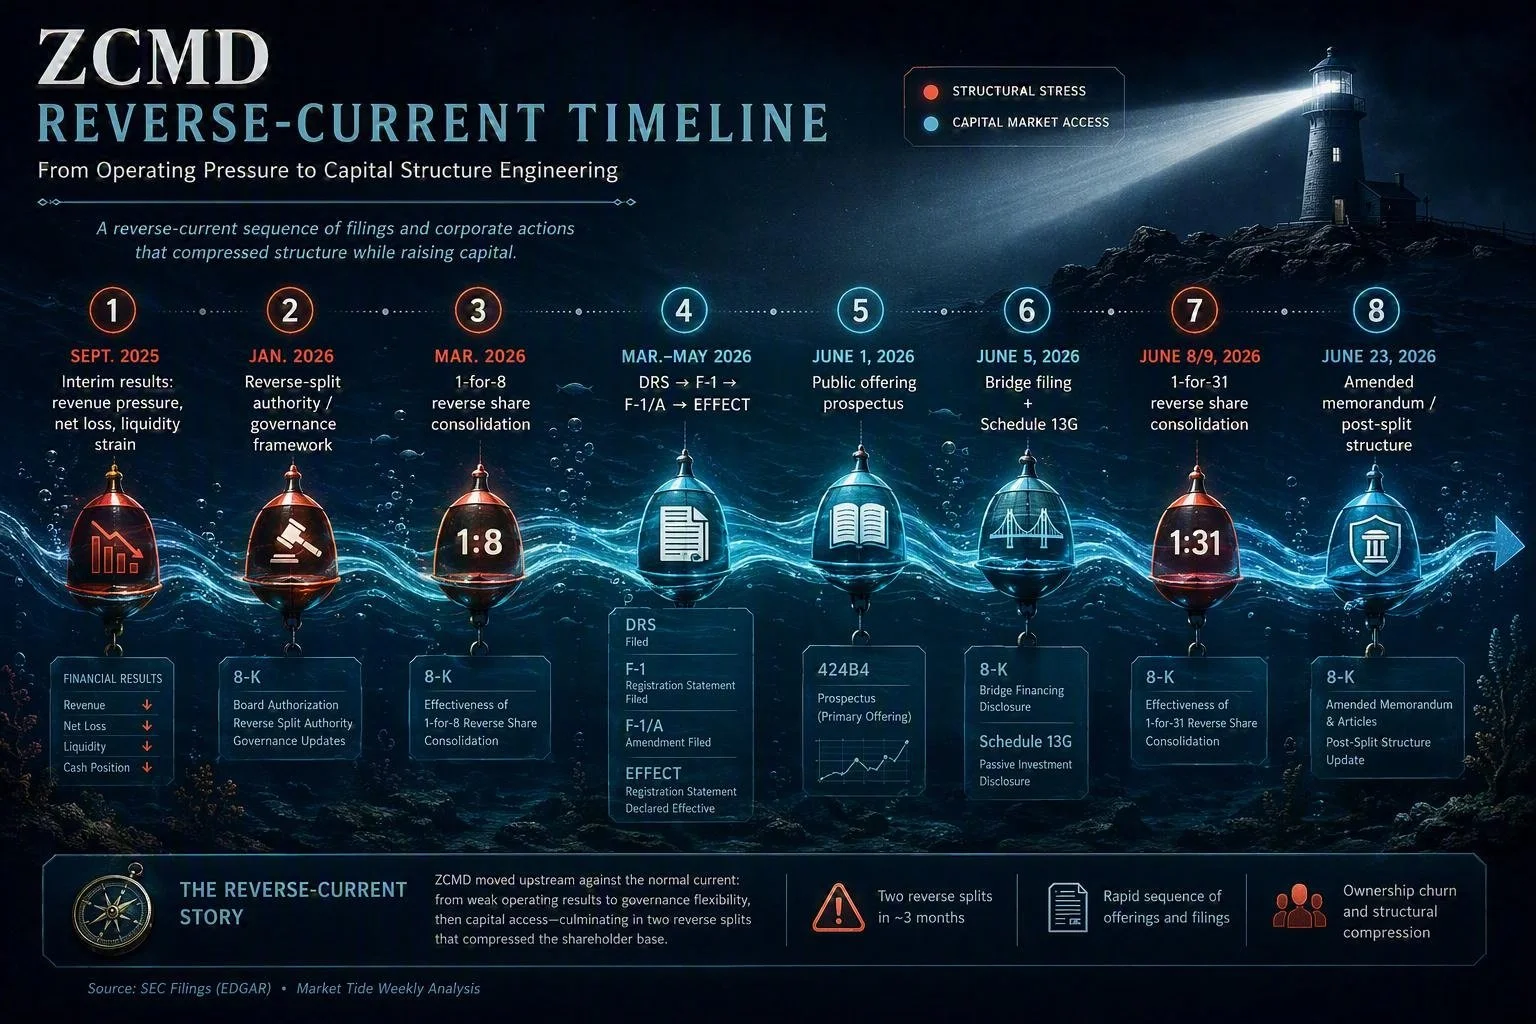
Viewed individually, each filing appears routine. Viewed as a sequence, the events form a reverse-current pattern: operating pressure, governance flexibility, capital-market access, and successive share consolidations compressed into a matter of months.
MTW Public Bottom Line
ZCMD is not a clean recovery story yet. It is a structural-risk case: pressured operating disclosures, foreign-private-issuer governance flexibility, repeated reverse share consolidations, an active offering cycle, and warrant-linked financing. If future filings show operating improvement, the story can change. Until then, the more useful read is cautionary: when the capital structure starts doing more work than the business, investors should slow down and read the tide.
Follow the Tide
If you want the deeper read — the full filing sequence, the structural timeline, and the Lighthouse signal map behind ZCMD — join the Market Tide Weekly subscriber list. Each week, we track the filings, pressure points, and continuity signals that can reveal where the tide is turning before the surface chart makes it obvious.
Get the full subscriber Deep Dive, the two additional weekly picks, and the Lighthouse signals before they reach wider circulation.
Market Tide Weekly is for informational and educational purposes only. Nothing in this newsletter constitutes investment advice, a solicitation to buy or sell any security, or a guarantee of any outcome. Past performance of featured picks is not indicative of future results. All investing involves risk, including the possible loss of principal. Readers should conduct their own due diligence and consult a qualified financial advisor before making investment decisions. Market Tide Weekly and its operators may hold positions in securities discussed.
Reposted 7/10/2026 with no updates.